2020 General Election
This page includes links to data and resources related to the 2020 General Election. For questions or to report a problem contact the team at indicators@iastate.edu.
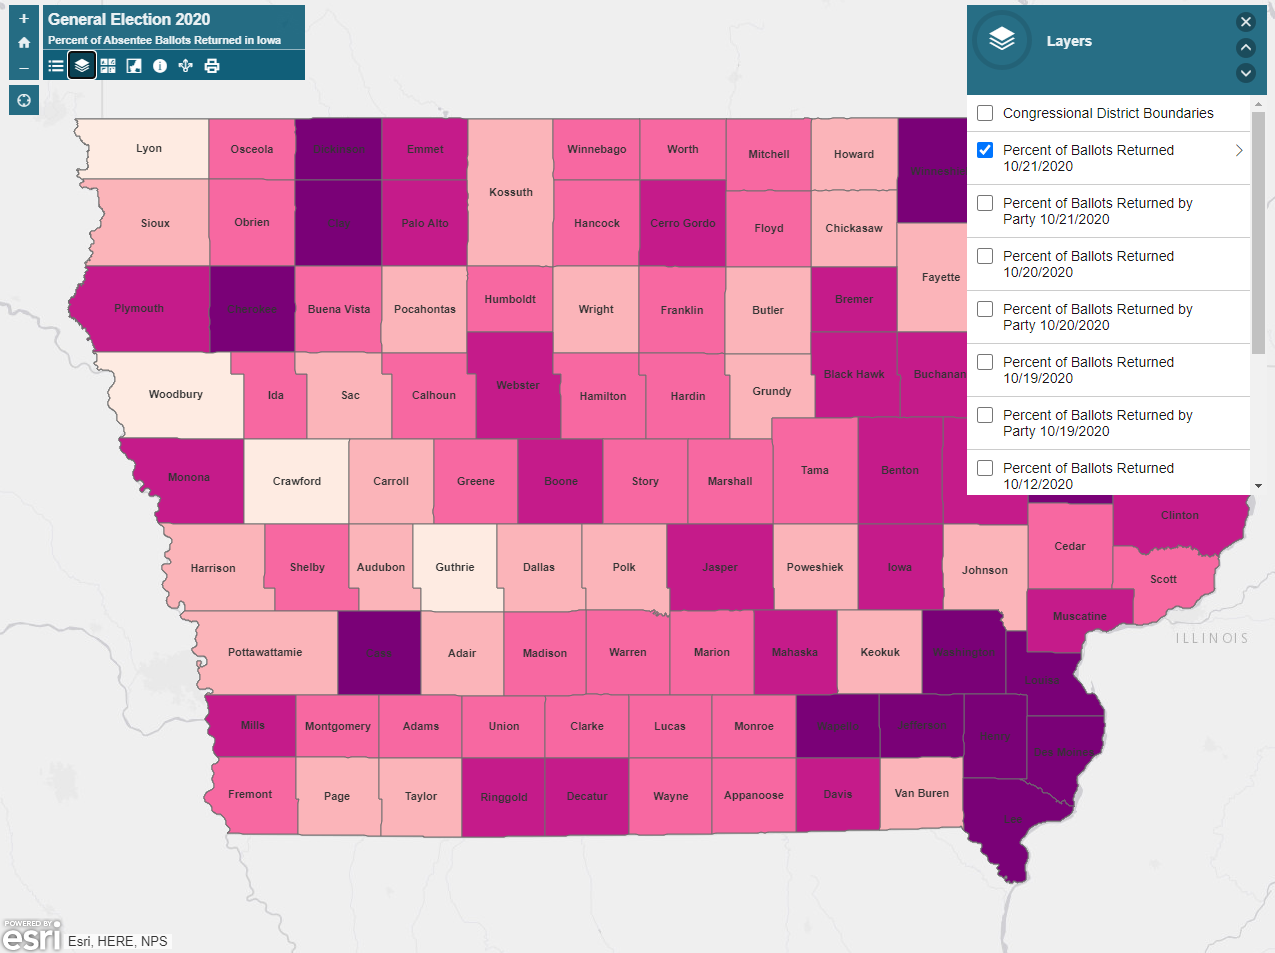
Absentee Voting Results Webmap
Absentee Voting Results Dashboard
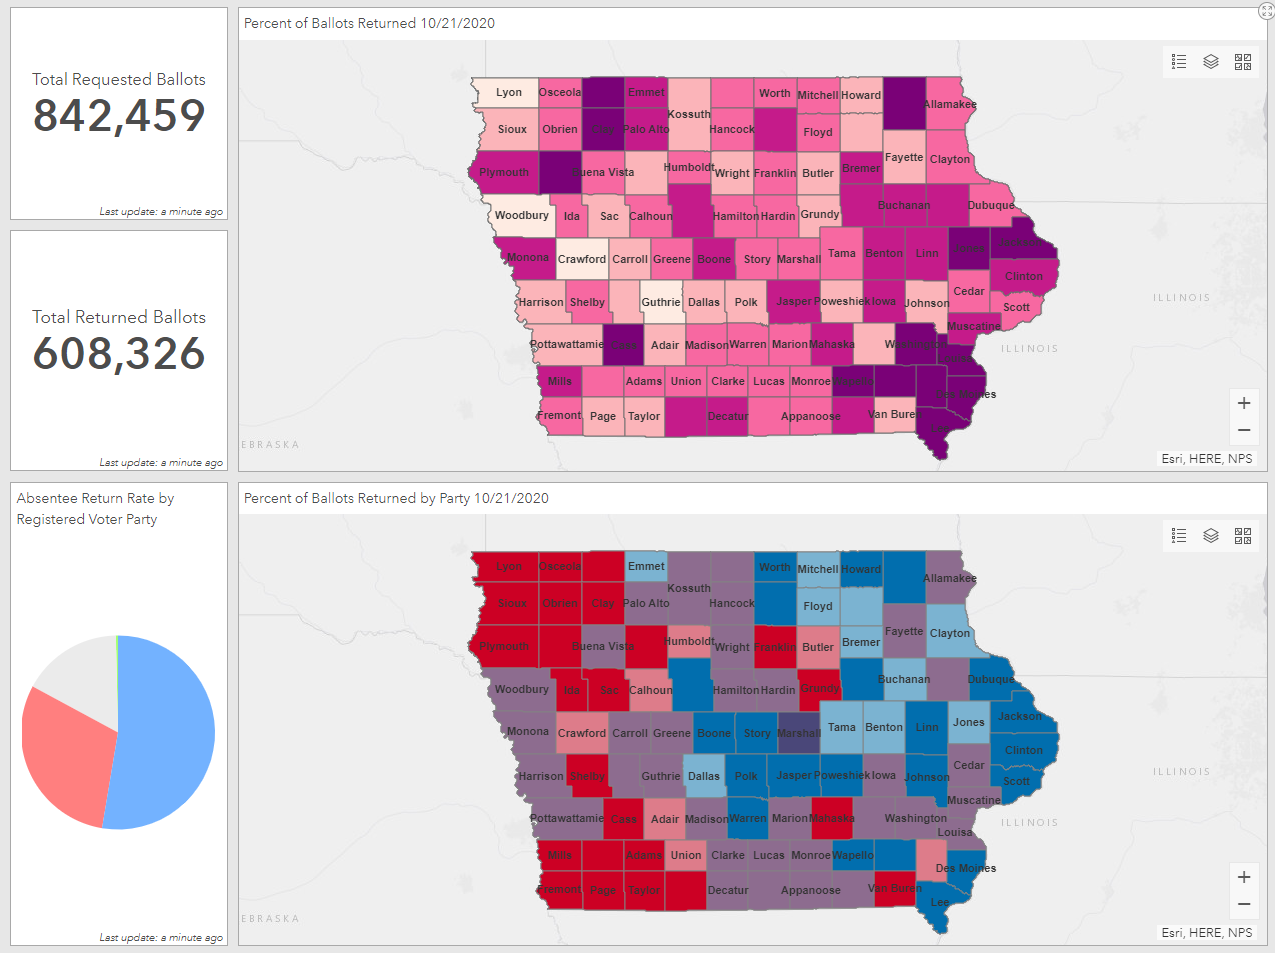
This dashboard includes maps and graphics updated daily showing the rate of returned absentee ballots in counties in Iowa. The map layers show the same information that's in the web map but includes a pie graph and text showing the total requested ballots and the total returned ballots for the state.
This map shows the daily percent of returned absentee ballots by county in Iowa. Darker colors indicate a higher rate of returned ballots. The Percent of Ballots Returned by Party layer uses a bivariate color scheme to indicate the percent of absentee ballots returned by the registered voters party. The bright red color represents a high rate of registered republicans returning absentee ballots and a low rate of registered democrats, the reverse is true for the bright blue color.
Original Data Source: Iowa Secretary of State Election Results and Statistics
Access the above data source in PDF and Excel format